ErasmusGravity
Where do Erasmus students go, and what makes a destination attractive?
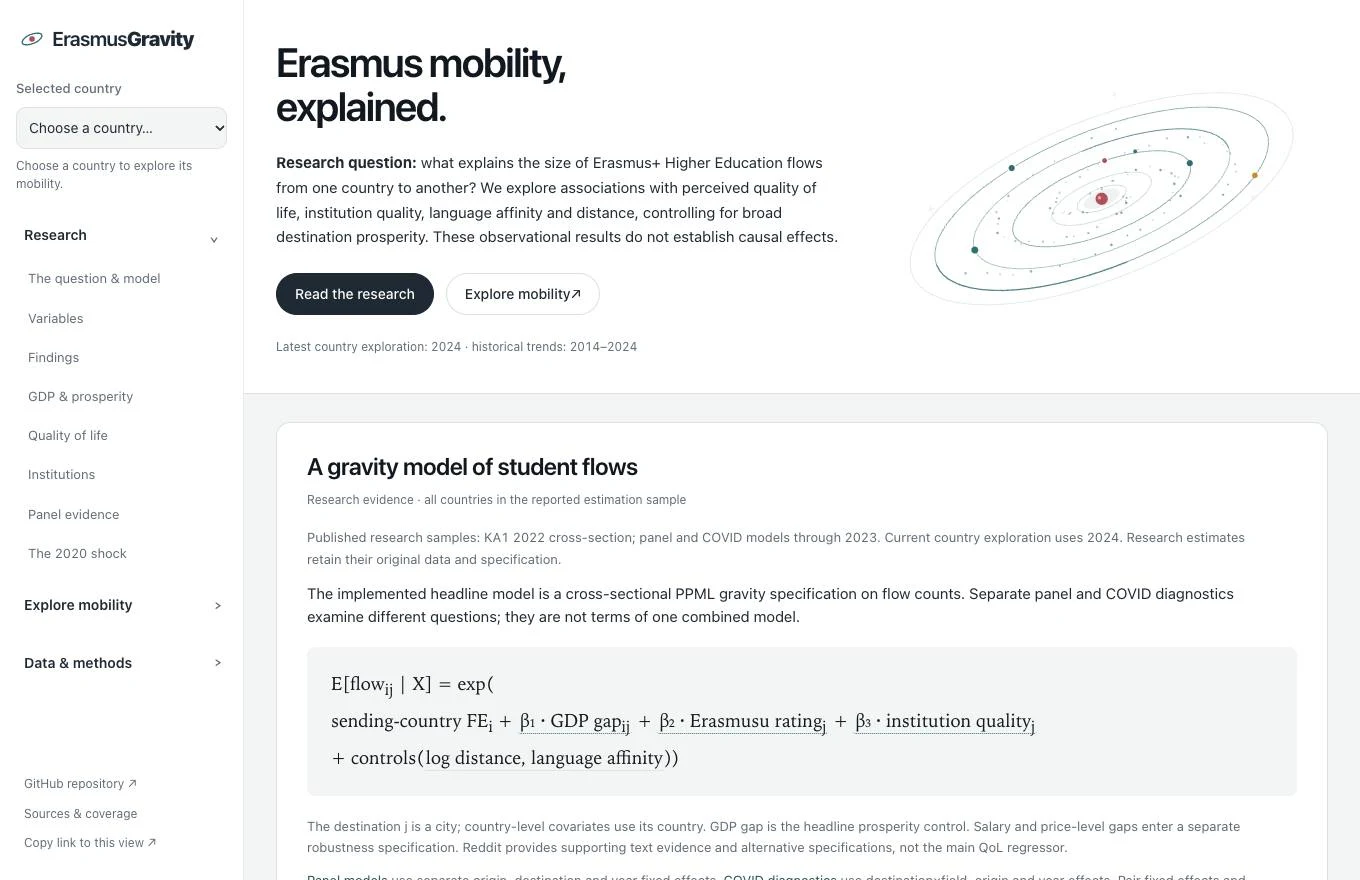
A research project and interactive dashboard for exploring Erasmus+ mobility: countries, universities, economic indicators and student perceptions.
The problem
University mobility choices involve distance, academic opportunities, economic conditions and perceived quality of life. Evidence is spread across Erasmus+ records, official statistics and online accounts. The challenge is to connect these sources while keeping their provenance, reference periods and interpretation limits clear.
The work
I developed ErasmusGravity for Text Analysis for Economics at USI Lugano. The project combines a data-preparation pipeline, spatial and text analysis, exploratory models and a public interface. The code keeps the original research samples separate from the newer data used in the explorer.
From mobility records to universities
The explorer uses KA1 study mobility in 2024: 294,907 mobilities across 158 countries, including international partners outside Europe. Views range from country flows to individual university pairs, with maps, filters and search. Names in different scripts are preserved; institutions absent from the source remain explicitly unreported.
Economics, perceptions and research
World Bank and Eurostat indicators sit alongside mobility flows. Destination ratings and LLM-assisted extraction from Reddit add evidence about student perceptions. Research results retain their historical samples: they describe associations without establishing causal effects on destination choice.
Several ways to explore the same evidence
Choose a country, switch between outgoing and incoming mobility, compare partners, read historical series and search universities. Views share the selection and compatible filters; a link lets visitors share their exploration context.
The result
A public dashboard for reading the method and findings or exploring the data directly. The repository contains the code and source documentation; interface and descriptive-data updates do not rewrite the original research estimates.
Role and tools
Research, data preparation and analysis, exploratory modelling, dashboard design and development.
Python, pandas, SQLite, spatial and text analysis, JavaScript, Leaflet